2020 Status Report on Women and Additional 2020 Data

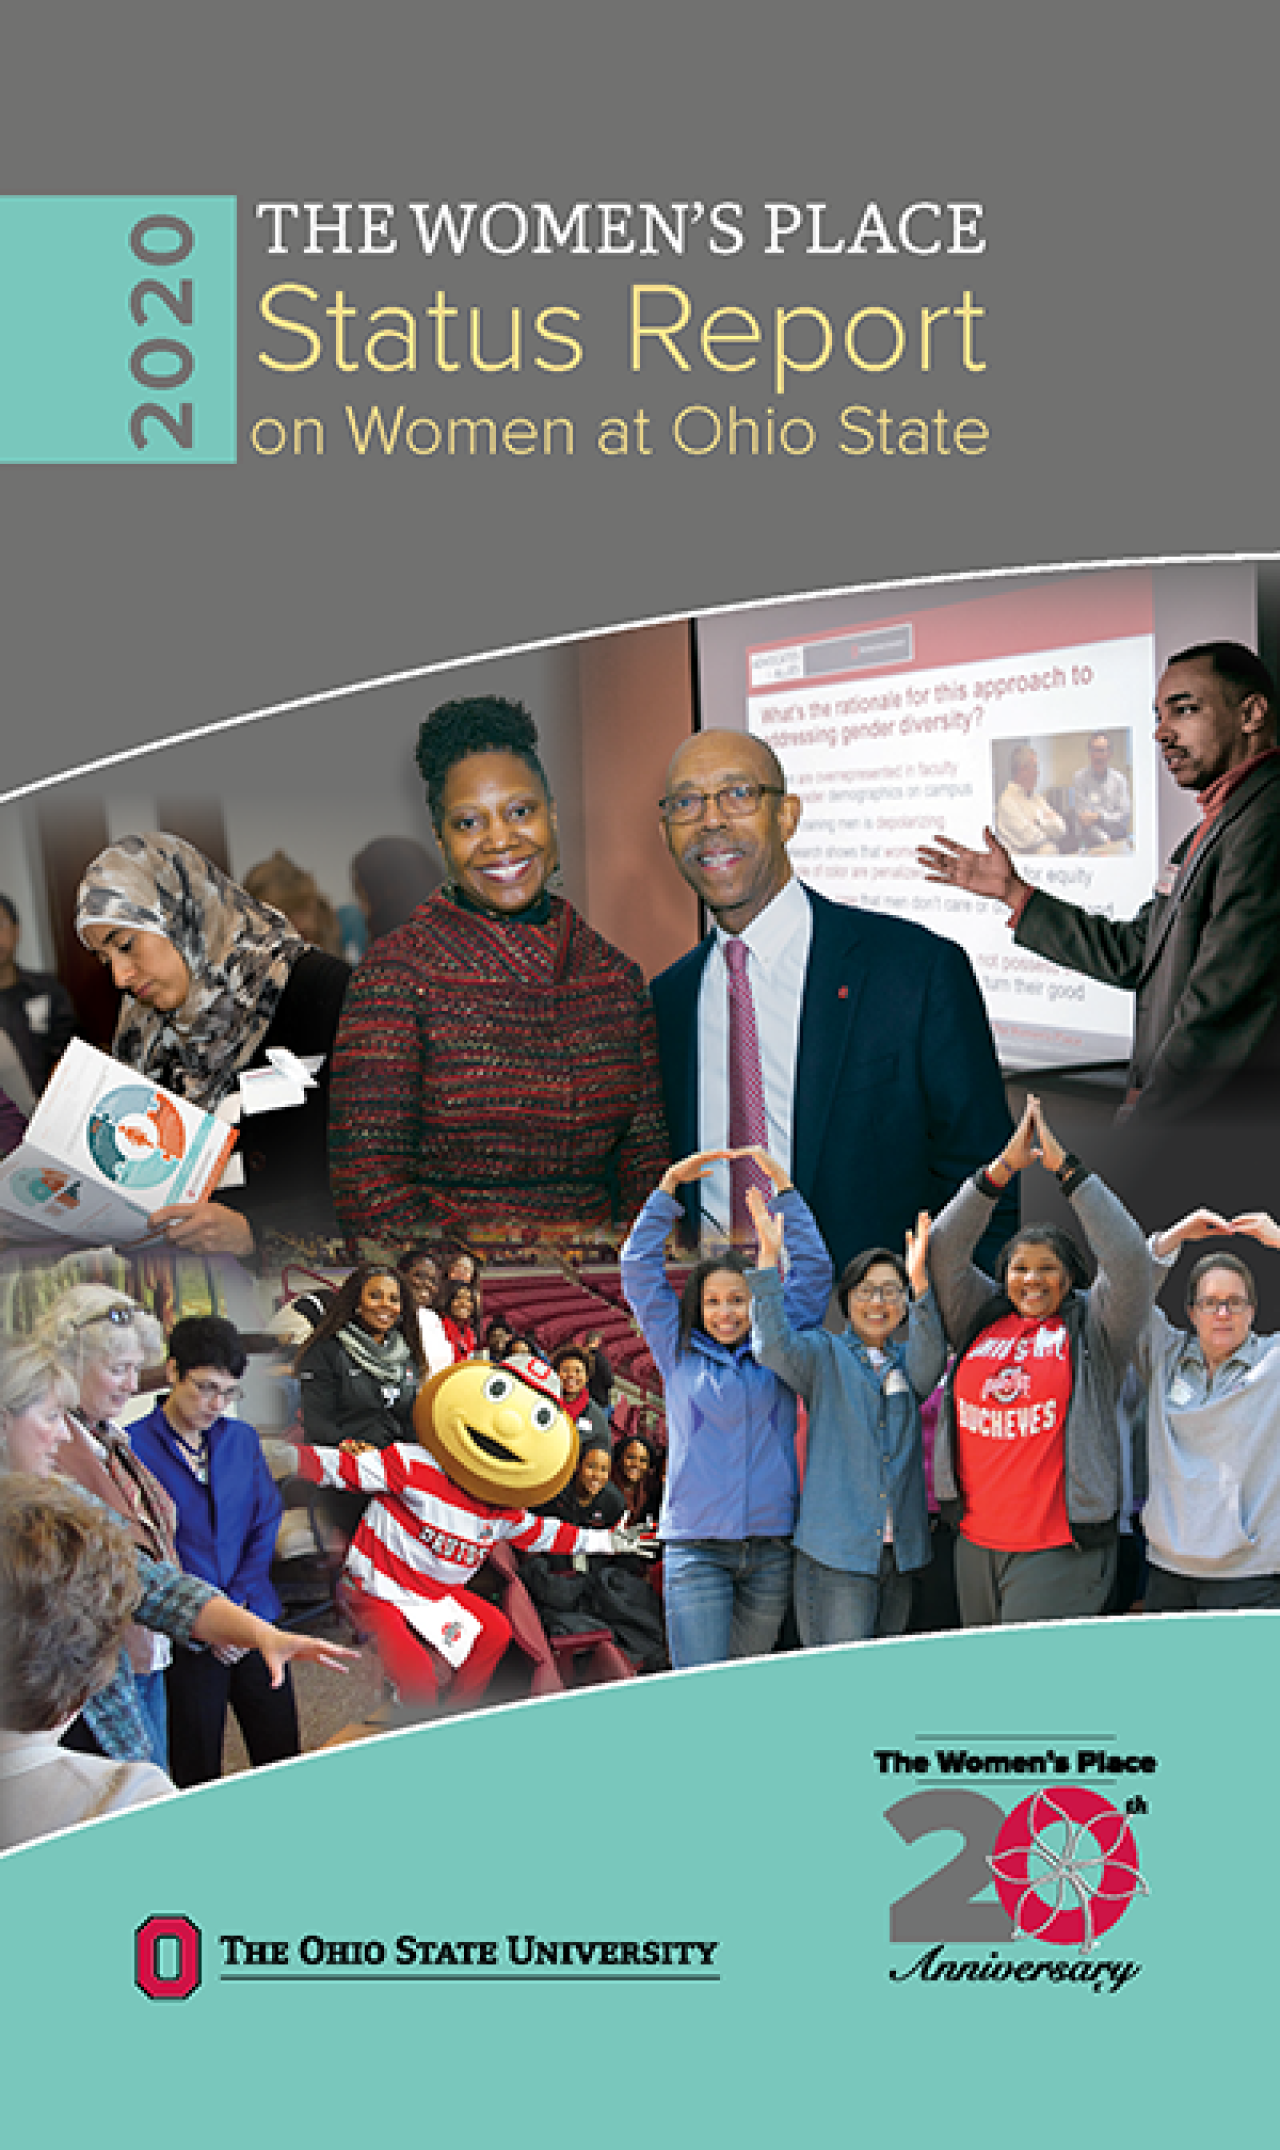
Cover of the 2020 Status Report

2020 Status Report on Women at Ohio State

The status report uses data to evaluate progress toward increasing diversity and promoting equity for staff and faculty women. In doing so the report identifies successful areas and areas where more work is needed. The 2020 report provides 2019 data.
Additional 2020 Status Report Data

Below is data not included in the print or pdf version of the 2020 Status Report on Women.

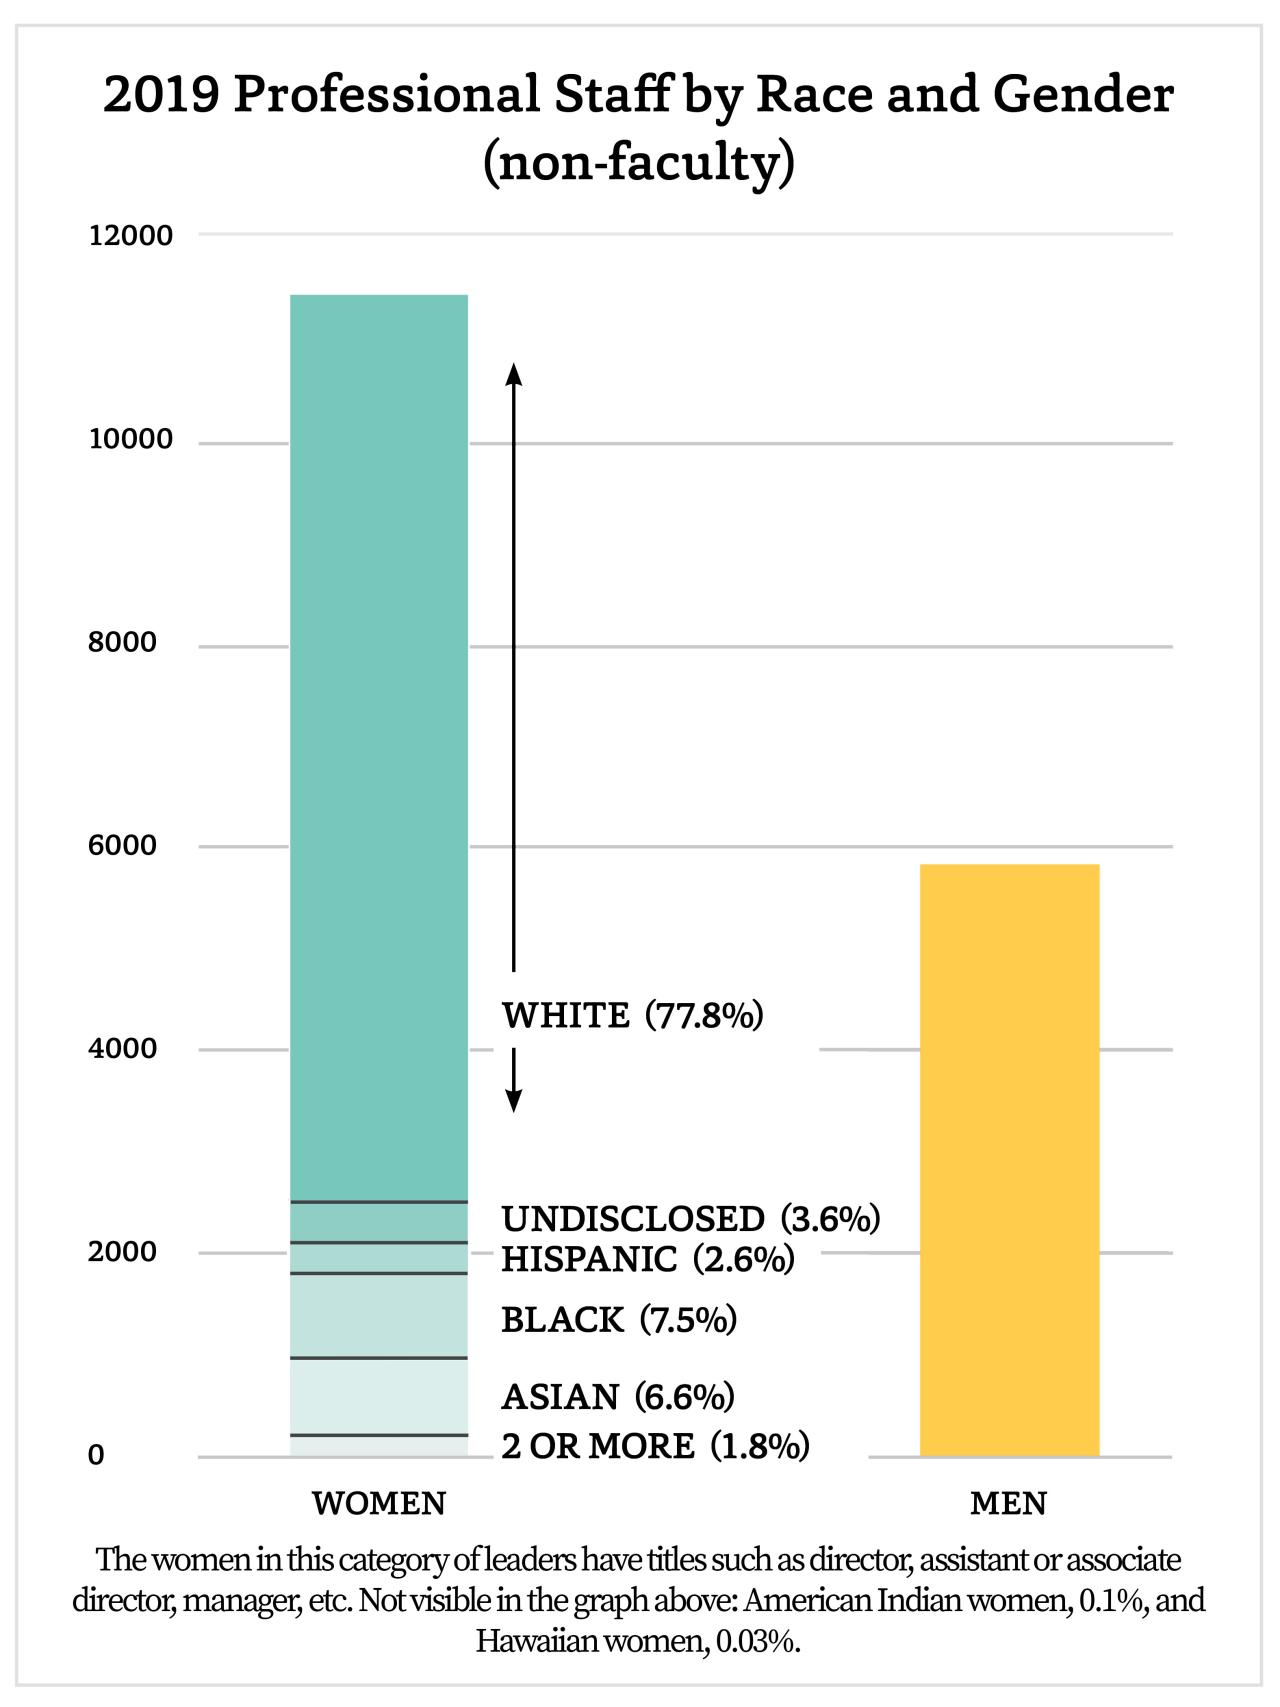
A vertical bar chart titled “2019 Professional Staff by Race and Gender (non-faculty)”. Women: 11,438. Among female non-faculty members, 77.8% are White, 3.6% are undisclosed, 2.6% are Hispanic, 7.5% are Black, 6.6% are Asian, and 1.8% are 2 or more races.  Men: 5,833. A footnote under the graph reads “The women in this category of leaders have titles such as director, assistant or associate director, manager, etc. Not visible in the graph above: American Indian women, 0.1%, and Hawaiian women, 0.03%.”
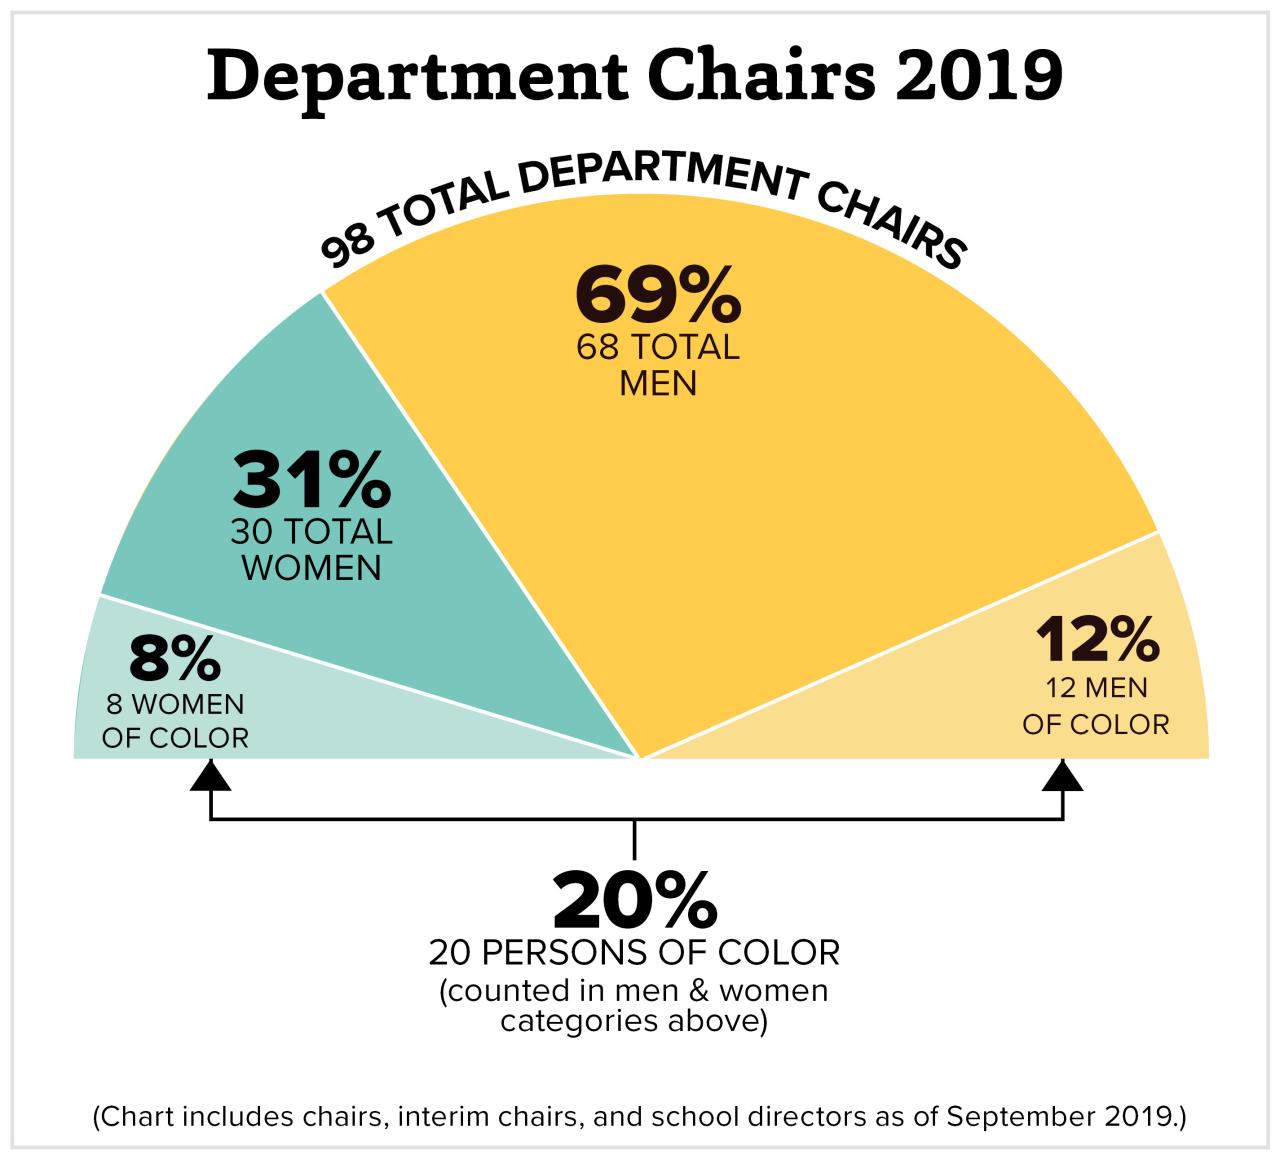
A half pie chart with four slices titled “Department Chairs 2019” that demonstrates the distribution of race and gender among the 98 department chairs at Ohio State. There are 68 male department chairs (69%), 12 of which are men of color (12%). There are 30 female department chairs (31%), 8 of whom are women of color (8%). 20 of 98 department chairs (20%) are persons of color. The legend below the graph reads "(Chart includes chairs, interim chairs, and school directors as of September 2019).”