2017 Status of Women at Ohio State Spotlight


Additional 2017 Status Report Data

Data collection for the report is an on-going process to help us keep a pulse on women's progress at Ohio State. Below is data not included in the print version of the 2017 Status Report on Women.

Correction to the 2017 Status Report data: The number of women senior vice presidents in 2016 was 9 out of 24, and the number of women of color senior vice presidents in 2016 was 1.
Status of Women at The Ohio State University: Wexner Medical Center Personnel - 2016


Women

Men

Total

Non-faculty executive staff at the Medical Center only

  698

236

934


Non-faculty executive staff university-wide

  1301 

720

2021


Other professional staff at the Medical Center only

  5712

1534

7246


Other professional staff university-wide

  9596

4549

14145

 
  • 46% of all (men and women) non-faculty executive staff are WMC personnel.
  • 51% of all (women and men) other professional staff are WMC personnel. 
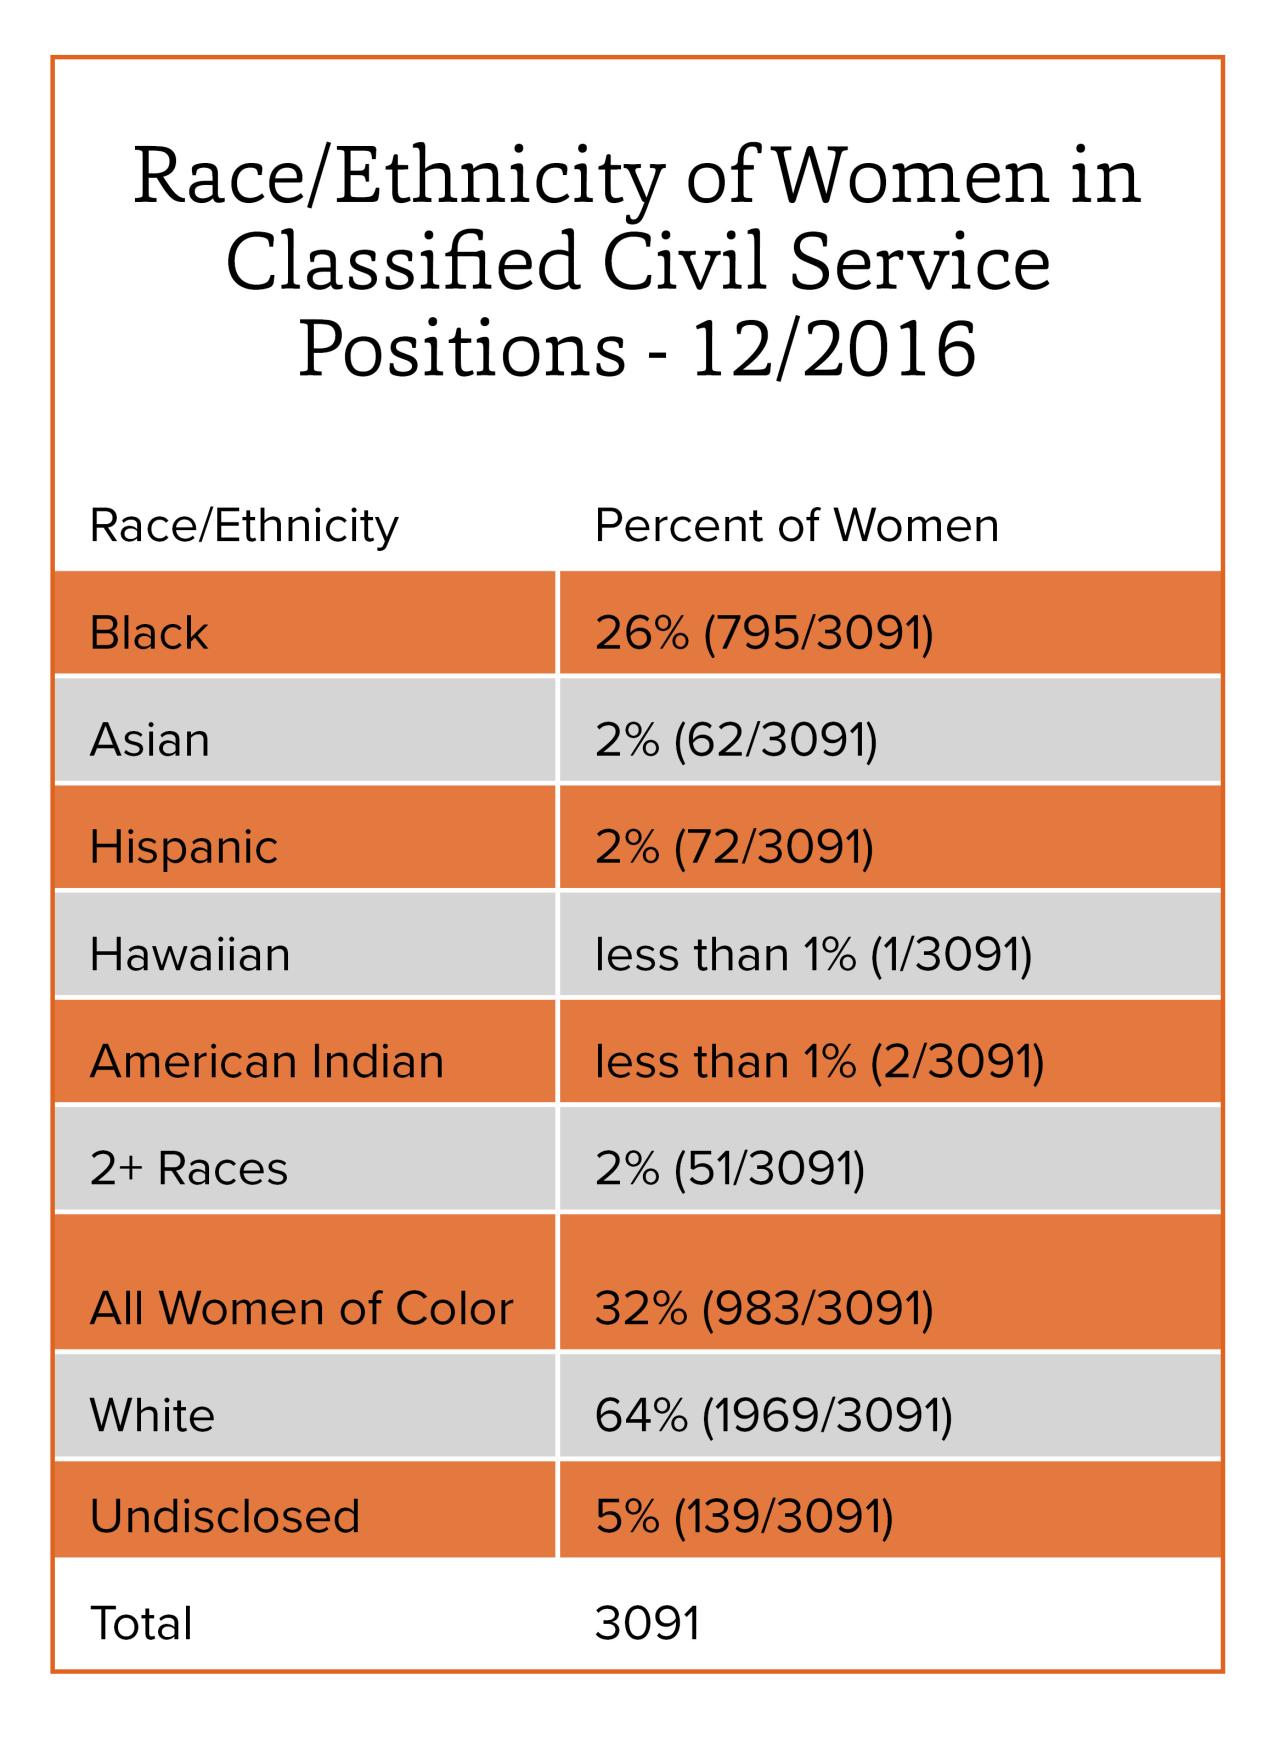
A table with data on race/ethnicity of women in classified civil service positions at The Ohio State University as of December 2016. Of the 3091 total women in these roles, 32% are women of color, while 64% are white women.
Race/Ethnicity of Women in Classified Civil Service Positions - 12/2016

Race/Ethnicity

Percent of women

Black

    26% (795/3091)

Asian

    2% (62/3091)

Hispanic

    2% (72/3091)

Hawaiian

    less than 1% (1/3091)

American Indian

    less than 1% (2/3091)

2+ Races

    2% (51/3091)

All Women of Color

    32% (983/3091)

White

    64% (1969/3091)

Undisclosed

    5% (139/3091)

Total Women

    3091

 
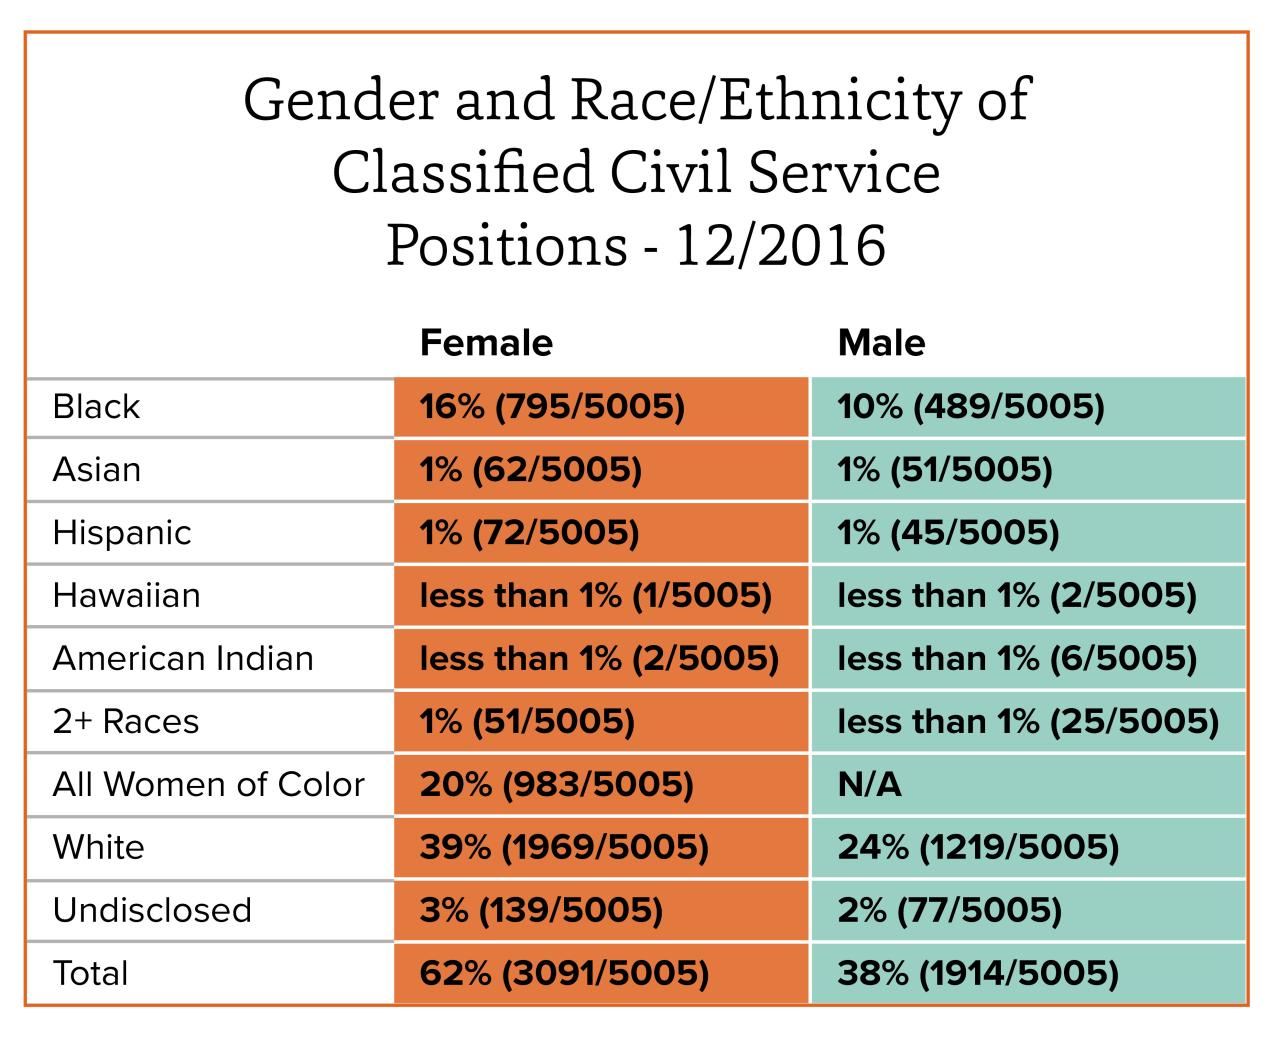
A data table with information on gender and race/ethnicity of classified civil service positions at The Ohio State University as of December 2016. 62% of classified civil service positions were filled by women, and 38% were filled by men. 39% of these roles were filled by white women, and 24% were filled by white men.
Gender and Race/Ethnicity of Classified Civil Service Positions - 12/2016 


Female

Male

Black

  16% (795/5005) 

10% (489/5005) 

Asian

  1% (62/5005) 

1% (51/5005) 

Hispanic

  1% (72/5005) 

1% (45/5005) 

Hawaiian

  less than 1% (1/5005) 

less than 1% (2/5005) 

American Indian

  less than 1% (2/5005) 

less than 1% (6/5005) 

2+ Races

  1% (51/5005) 

less than 1% (25/5005) 

All Women of Color

  20% (983/5005) 

N/A

White

  39% (1969/5005) 

24% (1219/5005) 

Undisclosed

  3% (139/5005) 

2% (77/5005) 

Total

  62% (3091/5005) 

38% (1914/5005) 

 
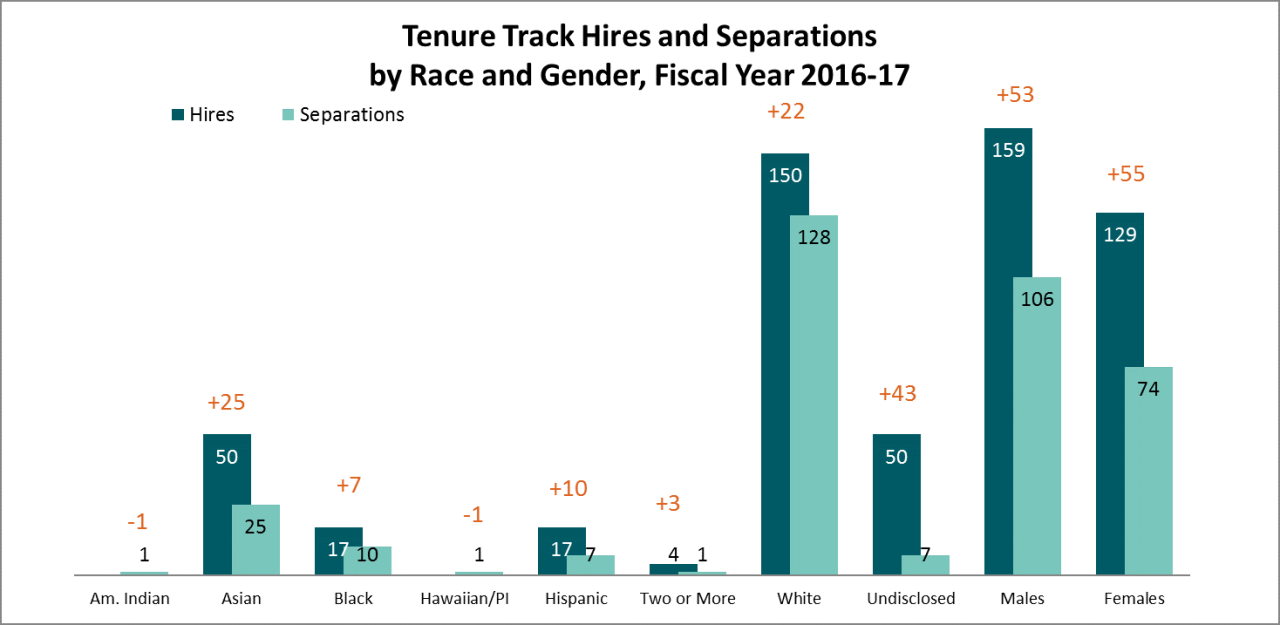
Vertical bar graph demonstrating hires, separations, and net gain or loss of tenure track positions at The Ohio State by race and gender for the 2016-17 fiscal year. Among males there were 159 hires, 106 separations, and a net gain of 53. Among females there were 129 hires, 74 separations, and a net gain of 55. White personnel made up the majority of hires (129) and separations (128) for a net gain of 22.
Tenure Track Hires and Separations by Race and Gender, Fiscal Year 2016-17


Hires

Separations

Change

American Indian

  0

          1

    -1

Asian

  50

          25

    +25

Black

  17

          10

    +7

Hawaiian/PI

  0

          1

    -1

Hispanic

  17

          7

    +10

Two or More

  4

          1

    +3

White

  150

          128

    +22

Undisclosed

  50

          7

    +43

Males

  159

          106

    +53

Females

  129

          74

    +55